
But why can’t I just push out an application to production?
No large-scale enterprise company – or for that matter, even a small start-up of 20 people or a mid-size organization – goes about building a system with zero data collections. Data collection is everywhere. It’s ineluctable and inescapable.
Data needs to be collected to measure key measures – system performance, resource consumption, traffic spikes, packet delays, error rates. Without extensive collection and telemetry, the modern world would be a lot less modern. Now throw in the explosive growth of IoT ( Internet-of-Things), nearRT ( real-time ) streaming systems taking over batch systems, and an ever-expanding landscape of use cases for technical products – metrics and monitoring is growing.

How to think about what metrics to collect?
Samantha is an entry-level junior engineer, and she looks at her senior engineers or senior staff engineers and goes thinking “how they heck do they know what to even collect”. It seems like rocket science to her. Wait, I was supposed to think about frequency of auto-scaling action triggers or the visibility timeout of message queues? I didn’t learn any this stuff back in my Undergraduate Algorithms or my Operating Systems class.
The good news for Samantha is that good old common sense and a couple of thinking patterns can help identify where to begin. Let’s delve into some helpful strategies.
- Ask around : Identify organizational pain points and frequent systematic failures – if machines are frequently shutting down, it’s worth investing into crash-related errors, such as the frequency of LOG:FATAL messages in centralized logging.
- Think of analogs to existing systems : Suppose you have to collect metrics for Apache Kafka queues, but you don’t know much about Apache Kafka. But wait, you come in knowing AWS’s equivalent offerings such as Amazon SQS ( Simple Queue Service ) ( https://docs.aws.amazon.com/AWSSimpleQueueService/latest/SQSDeveloperGuide/welcome.html ) or Amazon KDS ( Kinesis Data Streams ) . You might know metrics such as message size, number of shards, and visibility timeout .
- A hypothesis always helps : The best thing to do in this profession is to make a hypothesis, where you want to prove an issue is X, based on Y. Then collect metrics for Y to assert that statement X holds true.
- Trial-and-error : When in doubt, try things and see what works. Your gut instinct and intuition can be surprisingly right – if you think it’s X, it’s probably X. As they say, where there’s smoke, there’s fire.
- Leverage your past experiences and domain expertise? : You may not have worked with average latencies ( P50-P95-P99 analysis ), but what about other systems in your technical domain? Maybe you had to analyze disk usage and how many page blocks you read or wrote back in your operating systems class. Or you built out a single HTTP request-response in a simple web app – hey, timing network calls is always a good start.
But what if I collect the wrong thing?
Actually this can be worthwhile too, because you’ll know what not to collect the next time you develop out your features. Fortuity has it that we’re in 2025 ( as of the time of this writing ) and not the 1950s – HDD ( hard-disk space ) and I think lower-end SSDs ( Solid-State Drives ) are surprisingly inexpensive. Five positive 8-byte only integer metrics collected at worst for breaking production for one day in a streaming system processing 1 million records daily would consume (1 million * 8 bytes * 5 metrics ) = 40 KB of hard-disk space. We can quickly clear that out.
How to Collect, Process, and Store Metrics? The pros and cons of each approach.
- Local Log Files : Stored on the disk of each machine where an application executes
- Event Streams : To the event stream for nearRT streaming analytics. Consumers process the streams at the granularity of single events or as mini-batches
- Push :Leverage lightweight, easy-to-install push collection agents on each machine and forwarding to a separate cluster for longer-term persistence storage ( e.g. a time series database or centralized logging )
- Pull : Expose a /metrics endpoint ( or use common endpoints like /health ) to continuously poll these endpoints for critical information
Useful Metrics To Collect
By no means is this a comprehensive list, but it’s a note-worthy list to get yourself started!
- Scaling/cluster-level: frequency of auto-scaling actions, the number of instances ( currently running, stopped, crashed )
- Machine-level : CPU, Disk, and RAM utilization, collected at scoped-down aggregated granularities : per second, per minute, and per hour.
- Cache-level: number of cache hits, number of cache misses, and differences noticed in benchmark environments on changes to cache policies ( e.g. FIFO, LIFO, LRU )
- Queue-level – queue lengths, number of queues, frequency of queue thresholds being crossed ( e.g. 70% of a queue full need to reroute payloads to other queues )
- Networks: Number of open connections, open ports, average RTT ( round-trip time ), one way times ( client-to-server and server-to-client ), traffic volume flowing
- Centralized Logging Error Frequencies: Log errors ( FATAL, ERROR, WARN ), error codes ( HTTP 4xx or HTTP 5xx errors ).
References
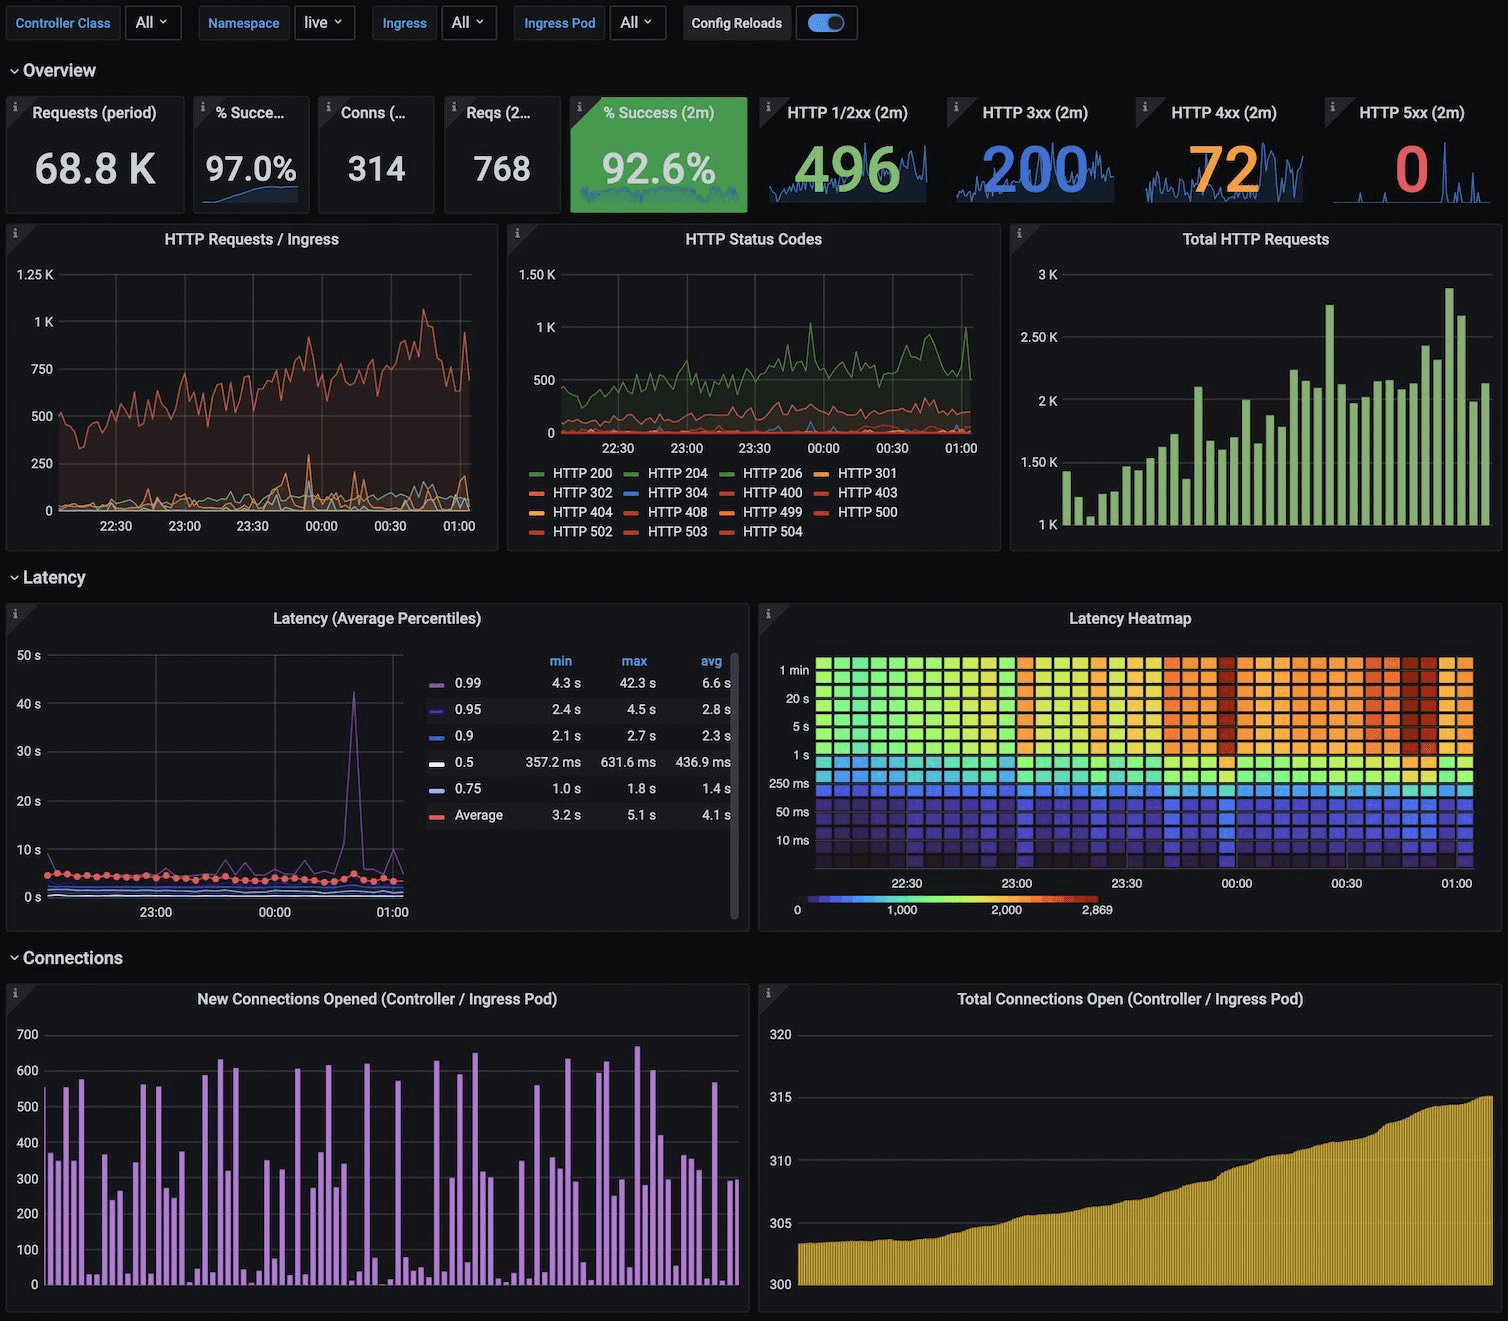
- Grafana image – https://grafana.com/static/assets/img/blog/kubernetes_nginx_dash.png
- System Design Interview – An insider’s guide – Vol 2, by Alex Xu’s . “Chapter 5 : Metrics and Monitoring”

Leave a comment