
Diagrams, Diagrams, Diagrams! Get me the diagrams!!! – A wise Principal Associate at a company I worked for in the past
Let’s play out the scenario
A junior engineer, Luis, is eager to present an incredibly technical topic on an up-and-coming multi-quarter project to her senior management and leadership. But before he can do so, his senior mentor figures, Estella and Anish, communicate to him in a design document review session to create diagrammatic figures.
Luis feels perplexed. Why do my senior and staff engineers keep emphasizing good, thorough diagramming ( or other forms of visual aids ) to their junior engineers? Hey, isn’t my code ( or my code with verbal, written documentations ) satisfactory? The code and documents explain enough. Most of my team members ( seem to ) understand what’s going on and what our systems are doing, plus the architecture remains the same. This is just an extra 30-minutes to 1-hour of work that I don’t need to go doing.
But au contraire, diagramming is useful work. It’s hard to understand the value of good diagrams, your scope is limited to feature development and coding on your team. You’re not the other parties. Such as your senior+ engineer who’s heavily involved in designing or upgrading existing systems as part of XFN ( Cross-Functional Work ) initiatives. Or your senior leadership and management who needs to make quick business decisions based on limited context. Or even product folks who need to quickly communicate their systems to non-product people and stakeholders.
Yes it’s not coding work, but it’s crucial work – difficult to do well in its own rights, for some folks more than others. Alright, let’s dive deeper.
What the others see that you don’t see – why visual aids?
- Your audience isn’t always technical : Visual aids help communicate to more than just an engineering audience. Audiences can span multiple types – brand new employees, product managers, management and leadership, or senior engineers on other teams. These audiences can not spend as much as time as you to throroughly understand your systems. Good engineers need to enable a fast understanding of operations, end outcomes, and the flow of data across systems.
- Design document credibility : diagrams strongly bolster the credibility of design documents.
- People love diagrams. Diagrams convey and communicate overly-complex technical concepts in a more ELI5 ( Explain-Like-I-am-Five) Form. State transition diagrams, for example, are hard to understand programatically or in writing, but are much easier to digest once diagrammed with vertices, edges, and sequence step numbers.
- Diagrams are frequently referenced : A Principal Analyst and a Senior Staff Engineer I once worked with were right!! Employees frequently reference diagrams. I’ve seen my state transition diagram referenced vertically during multiple pair programming sessions ( three three sessions were an hour-long ). I’ve also seen my architecture diagrams referenced in meetings involving multiple stakeholders. I think my diagrams were referenced in six plus meetings, each meeting 30 minutes long. There’s value add during those six hours of solid developer time.
- Real-time editing: I can quickly evolve and modify diagrams in real-time during engineering design discussions. I quickly jotted down textual notes and changed the directionality of arrows or the descriptions of components while absorbing inputs from more senior folks in my team or across teams.
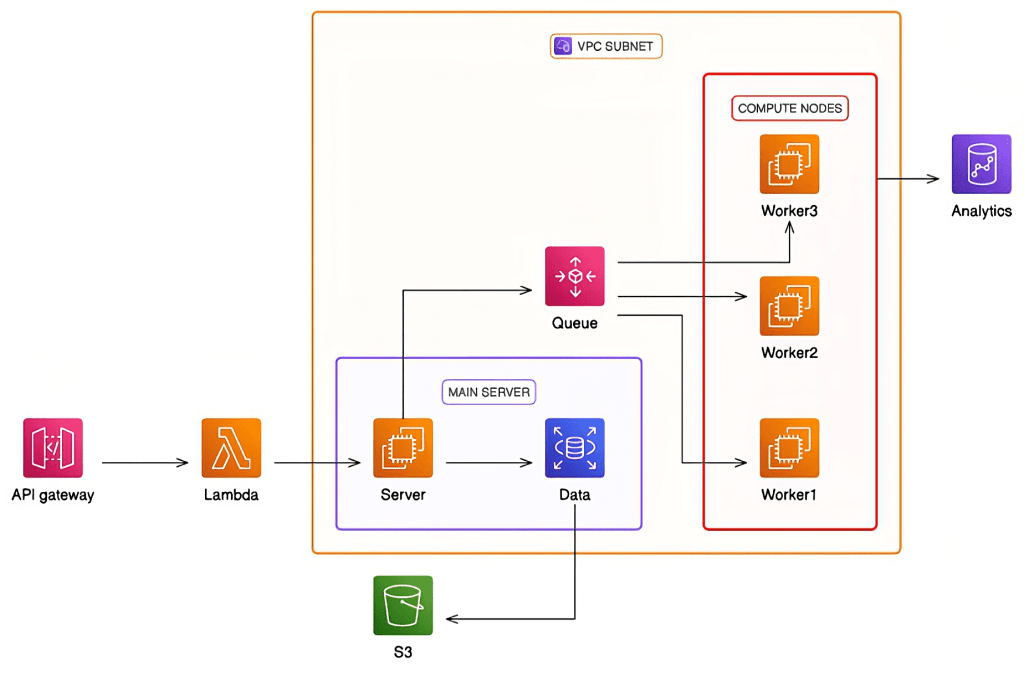
Can you show me a quick example of a digram people would reference?
Sure. Here’s a quick cloud architecture diagram I took from online
What should I be diagramming?
- State Transition Diagrams –
- Process Flow Diagrams –
- Product developments and roadmaps –
- System Design/Architecture Diagrams
But do I need to make overly complex diagrams?
Not really. You don’t need to have the following
1. A 100% fully correct diagrams
2. An overly comprehensive diagram that drills down to the level of process execution or thread execution
I’m not looking for overly complex diagrams.
For example, in a state transition diagrams, I am focused on showing the flow of data from data sources source, through multiple input processing/sanitization/validation/filtering stages, the decision tree states where branches split up, and the end outcome states : the applications or the end users who consume the data.

Leave a comment