harisrid Tech News

Spanning across many domains – data, systems, algorithms, and personal

  • BEHAVIORAL – Tell me your strengths and your weaknesses!

    “It is difficult to see the picture when you are inside the frame”

    Communicating your strengths and your weaknesses to anyone – especially in an interview setting – is difficult ( for the majority of us, some of us find this easier ). But how do I know what I am good at versus what I am bad at? No one else has ever explicitly told me what I’m good or what I’m bad at.

    It’s hard to gauge – especially when you can look at only yourself. But experiences when working with others can be especially enlightening and you may start to make a couple of observations. Such observations are going to be surprisingly correct. Alrighty then, let’s dive!

    My Strengths

    Everyone is good at something.

    When at least five other people in your life tell you that you’re good at something, you’ll know you’re good at something.

    1. Fast Pattern Matching – I am a very good pattern matcher! I was fascinated with patterns as a kid, and I love to think in patterns – data, trends, plots, etc., Patterns are super informative ; they help me optimize and make the best decision.
    2. Strong observational skills – I absorb, observe, and take in a lot of information from my environment; it enables me to enact rapid decision-making. I’m always learning and noticing things; it never stops.
    3. Analytical thinking – I love analyzing things. I love asking why. Why ( but really, Tell me why ) is my favorite question to ask. There’s always a reason for why things are the way they are.
    4. Associative thinking – harkens to pattern matching, but I like to think in associations ; if X is related to Y, and Y is related to Z, X has a relation to Z. Or take a word – conjure. My verbal associations are : Dungeons and Dragons, Wizards, Magic, or Fantasy. Think of drilling down the links of wikipedia across different topics 🙂 . Associative thinking lets me make connections in places that folks don’t typically connect.
    5. Abstract and Mathematical Thinking – I was a math major back in my undergrad days, and I leverage mathematical language to communicate ideas that might otherwise be hard to digest. Formalism, invariants, and a logical chain-of-thought reasonings boil down complexity into simplicity and enable peers towards quick understandings.
    6. Multi-perspective/Multi-lens thinking – I’m talented at viewing problems or challenges not just through my lens, but the lens of others – those coming from different audiences, backgrounds, and skill levels. It let’s me tailor my communication accordingly so that the other party understands execution and deliverables.
    7. Anticipating Future Scenarios; thinking about hypotheticals – When I built code, I like to think of all the ways something could fail or go wrong. Hey, do I need to think about input sanitization/validation? Do I need to think about bad actors? What if situation A happens? What if in three months, we have to suddenly shift to situation B?
    8. Detail-oriented thinking – I’m good at zooming-in and honing-in on specific system details ; I build up a comprehensive picture of complex systems from multiple smaller, independent units of systems.
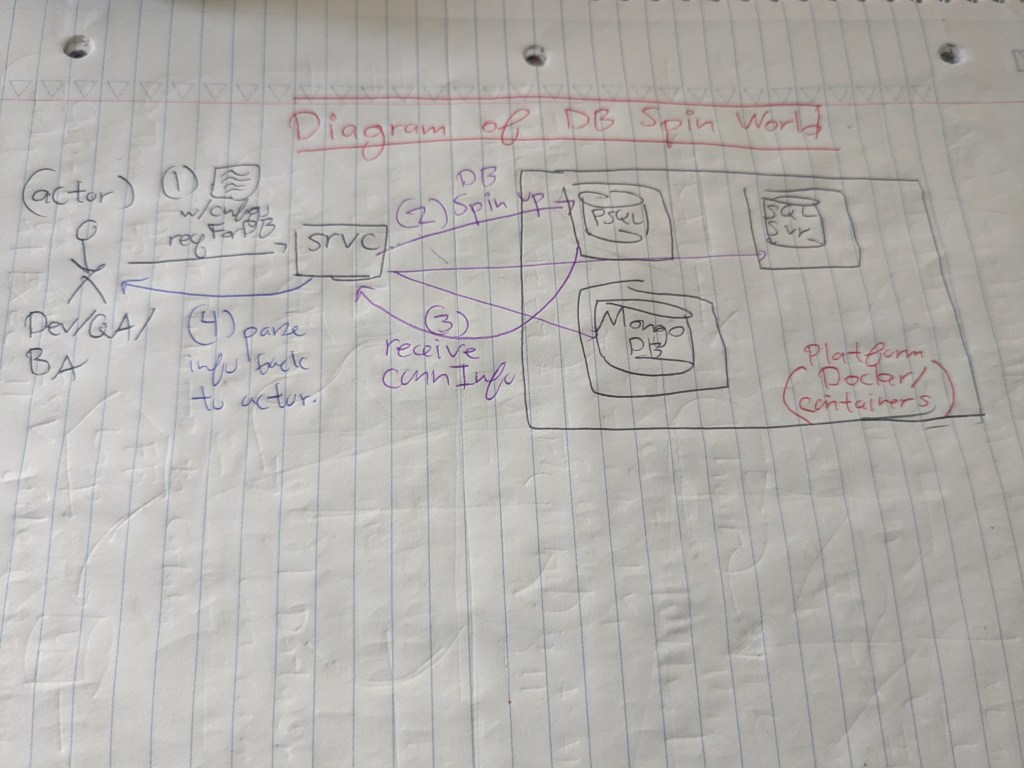
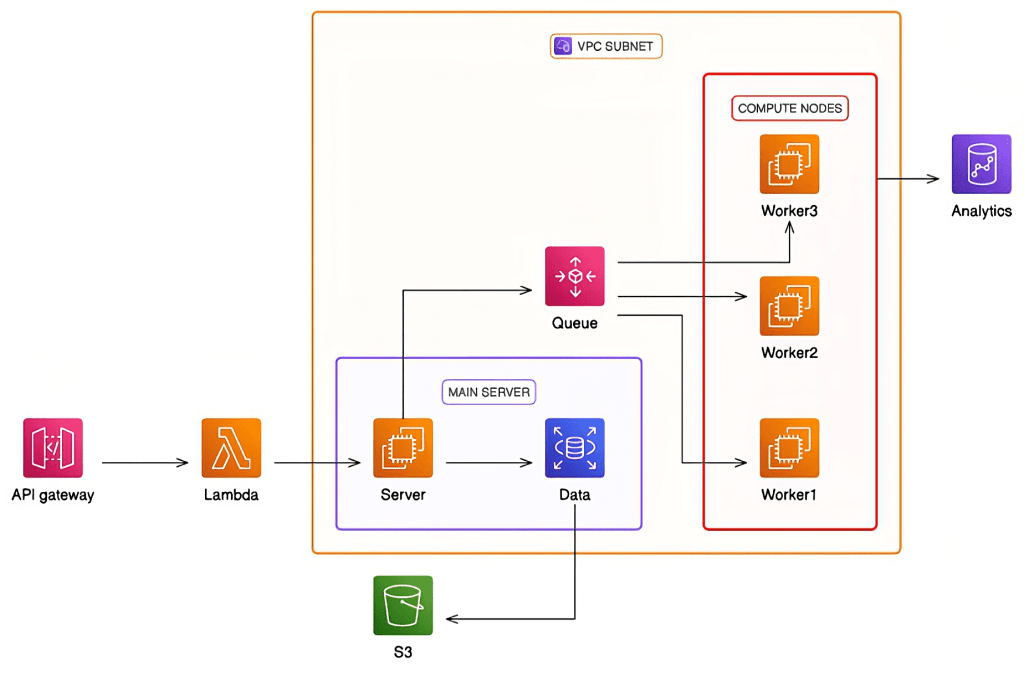
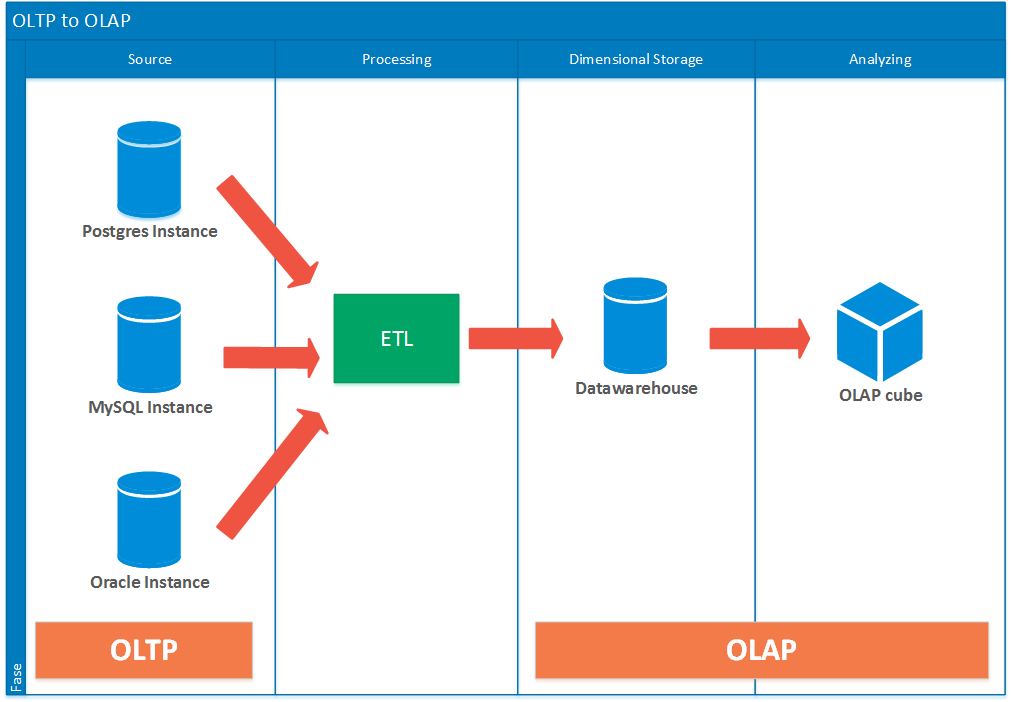
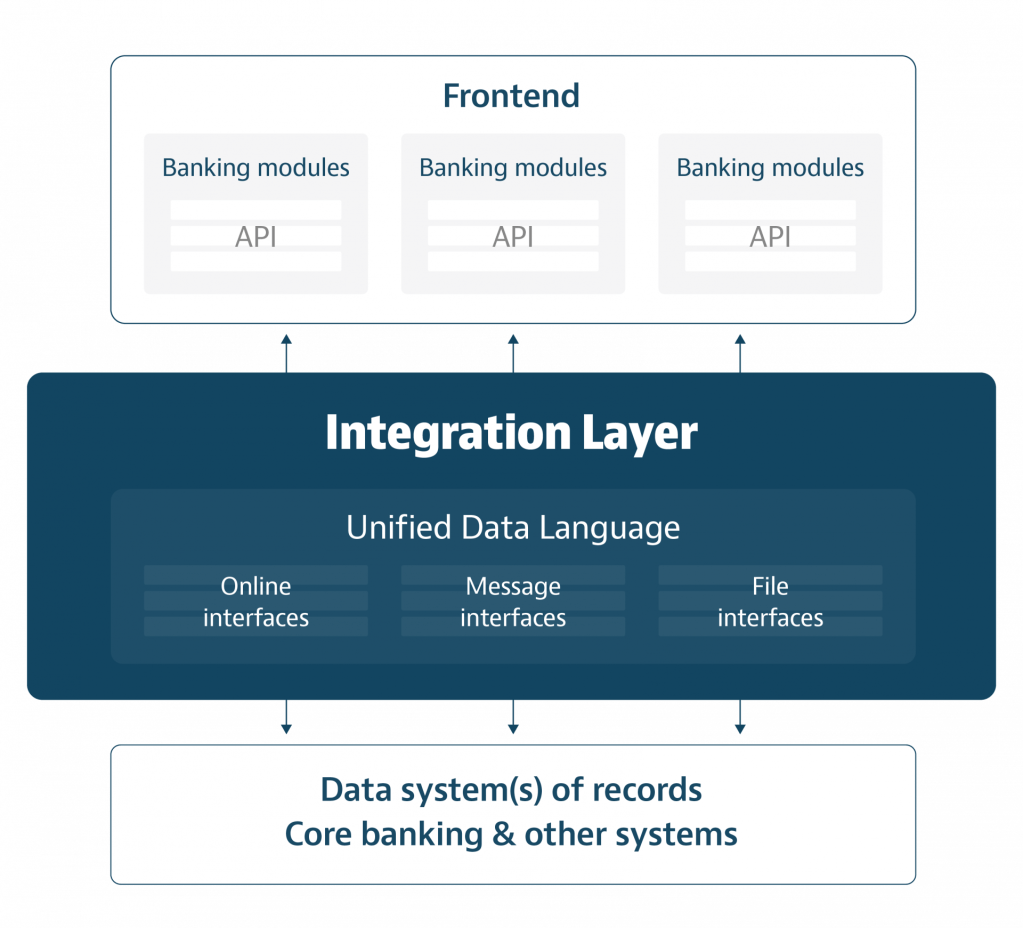
    9. Visual Thinking & Diagramming – I’m good at whiteboarding and diagramming systems and moving components. I can throw an architecture diagram and make quick changes to arrows or textual descriptions while listening to more senior folks on my team.
    10. Mentorship & Teaching – I love helping getting other people unstuck on what I do well; there’s a boost of dopamine I get when I see the lightbulbs flash in someone else – suddenly, they can connect the dots and see what they couldn’t see before. It’s like I helped someone re-wire their brain ; I changed their mental circuitry 🙂 ! When I was a senior engineer at Capital One, I helped a junior engineer deliver change lists faster and taught best coding practices and unit testing practices ( e.g. testing both the happy paths and the sad paths of code ). Over the course of weeks, I noticed improvements in their code velocity and reductions in code review cycles.
    11. Technical Writing and Documentation – I’ve had at least five different people tell me that I’m well-read and a solid writer. I like to tell others about the story where I was a L3 software engineer at Google, and my L5 senior software engineer told me that I wrote really good documentation on my project.
    12. Communication – when I was practicing interviews on interveiwing.io ( at the time ), I got feedback that while I wasn’t the technically best person, I communicated my ideas effectively. I’d see ratings of 4/5 for technical skills BUT 5/5 for communication skills.
    13. A good conversationalist – I’m good at holding a conversation and speaking to others. I always have something to say, to share, or to talk about. I can talk about a wide ( and I mean a WIDE ) variety of topics. You’ll never have something to not be able to talk to me about
    14. Encyclopedic– I’m told by others that I know a lot of pieces of information here-and-there. I rapidly connect topics across different places – perhaps unrelated.
    15. Leading Meetings and Collaboration – I’m a very extraverted and social engineer. Sure I like independent coding, but some of my best work is done in lockstep with others and NEVER in isolation. This includes past class projects and past work experiences. There’s always something that I learn when I pair program or develop solutions with other talent. If you need me to run a meeting, set the agenda, and get five people in my room, COUNT ME IN!!!

    My Weaknesses ( a.k.a. what I’m working on )

    No one is perfect.

    Everyone has a “crack in one’s armor” : an “Achilles’ Heel”, so to speak. We all have weak spots and vulnerabilities.

    Alrighty then, let’s get to the part we’re more scared to talk about ; the can of worms – our weaknesses!!!

    And oftentimes, let’s make a difference. Weaknesses aren’t always what they are. Maybe you just haven’t practiced a skill as much due to a lack of exposure of practice environments. Or you just didn’t need a skill in one environment, and it’s showing up in another environment.

    1. Analysis Paralysis – when there’s so many solution paths ( e.g. 10 different ways ) available to solve a problem, which path should we select? Should I select for the best? Go for the first one available? Or immediate bias to action? Do I need peer feedback, or can I dive-in and independently execute?
    2. Task Delegation – when you’re experienced, it’s easy to quickly execute on tasks. But no one can do everything in the world, and impact is made by being a force multiplier and getting large groups of people to deliver on long-term organizational goals.
    3. Downplaying impact – I tend to downplay my impact at work or the complexity of my tasks, but I fail to see that what’s easy for me isn’t always easy for other people, and that what I did really was a complex task. And sometimes, not just technically complex or in coding – maybe in systems thinking, working across stakeholders, or juggling multiple deliverables.
    4. Task Decomposition – Learning to break a large, ambiguous, long-term task into smaller, more concrete tasks is still a hard skill. I’ve improved with a combination of practice, exposure, and feedback from others more skilled than me. Good advice has been to engage in development in phases ( e.g. phase #1, phase #2, and phase #3 JIRA tickets ).
    5. Prioritizing Goals – Sometimes I’m working on a unit of code or a feature under development, and I get an update during a Sprint ; all hands need to change tasks to a completely different feature under development. Which I don’t mind, but I’m the type who likes to still work on what’s fresh on my mind and interesting. I’m working on context switching and combating the feelings of frustration with having to jump across tasks, versus keeping on my task of interest.
    6. Keeping the context and avoiding small details – sometimes I get side-tracked and look a bit to much into other systems. It’s a good thing ( for learning ), and sometimes, those side-tracks and tangents are useful. But in the grand scheme of the things, I need to shift focus to smaller areas and focus on the end goal – the deliverable. There’s a lot to learn and look into – meaning, there’s a lot that you don’t need to learn and look into.
  • TOTW/7 – Mock Your Data ; Quickly Overcome  your Enterprise Constraints, Major Blockers, and Access Issues

    Sometimes you gotta write fake data – or make up things that are close to real – in order to get things working.

    Fake it till you make it!

    Replay the scenario! What happens!

    Junior TDP engineer, Lolo, needs to write up unit tests and integration/end-to-end tests on a feature release, and in order to do so, has to acquire data from enterprises databases as her inputs. But Lo ( lo ) and behold, she’s unable to ; she’s facing a MAJOR BLOCKER! She can’t access her workplace’s PostgreDB instances. Lolo thinks the task is undoable, but wait, we’re software engineers, and we need to conjure and think about workarounds when faced with constraints. Lolo goes to her senior engineer, Arturo, who leverages the past experiences and the intuitions of himself and his other senior engineers, to set feature direction.

    Arturo collaborates with other engineers, weighs the pros and cons of decision making, and identifies the best solution across a set of multiple outcome paths, with pros and cons for each path :

    1. Feature/Test partitioning – Can we identify and partition tests into those dependent on database data versus those independent? Most unit tests can be written without a database dependency – it’s only regression tests or end-to-end tests that need them
      Pro : Splits up and decomposes tasks into independently executable, delegable units of work.
      Con : At some point, we’ll still run back to the same access issues.
    2. Use other data sources – Database one ( PostgresDB ) is unavailable for access, but what about the other database platforms? My application accesses other tables from SnowflakeDB, SqlServer, and DynamoDB, Can I leverage one of the other databases to meet testing needs?
      Pros :
      (A) If one of these sources is unavailable, it bypasses access request or connection difficulty issues
      Cons :
      (A) Assumptions that other sources are available
      (B) inability to verify if application will work in production for all edge cases
    3. Mock Data injection – We own PostgreDB instances – can we write scripts and inject mock data? Can we mock data at database tier or application tier, if a database is unavailable?
      Pros : Listed below!
      Cons : We can’t assert that our code works with actual production or non-production databases.
    4. Reprioritze feature development – maybe we can shift development focus elsewhere and wait for database access requests.
      Pros : Development effort is shifted elsewhere.
      Cons : Developers need to context switch from current task to other tasks. Access requests can take business days to resolve.

    How mocking data saves us! The benefits!

    • Avoid failure modes – if we need a database for testing, that means we need to assume we have the following
      a. AuthN and AuthZ : Authentication and Authorization
      b. Working machines . A database is a server or installed on a server.
      c. Network connectivity between machine and database
      d. Working database . A recent upgrade patch or competing processes could entail a failing database
      The failure mode list is comprehensive, but if we create mocks, we avoid all of the above; this saves on debug time and team discussion time.
    • Expedited developer velocity – mocking the data might entail half-an-hour to one-hour of work, but the time savings in not waiting on external third parties to get access or failure mode resolution means the ability to get back to focusing on change lists.
    • Ease of sharing and customization – mock data creation scripts can be inserted at application layer and customized according to environments. Other engineers can add, delete, or update the mock data for needs elsewhere.

    DB Spin – the real-world ideal scenario?

    Containerization – if I can’t access a machine, what if I make my own world up? I can leverage containers and technologies ( e.g. Docker or K8S ) to rapidly spin up and tear down resources. I just need a docker file, a database, and a mock script and BOOM, a testable input!

    Maybe in the future, a start-up or a major company can built a product for spinning up databases quickly on the fly. Imagine an engineer wanted to verbally describe – or pro-gramatically describe – how to set up a mock database. They could quickly spin up databases of different configurations ( platform, version, memory, disk ) and specify tables with records of information. They could spin up multiple databases on this application ( e.g. 5 databases ) and basic network configurations for development or testing purposes.

    It’d take a few months to a year to build out the MVP of the product, but it can save developers on costs and feature development time spent. K8S, Docker, or other container/orchestration technologies offer the capability, BUT, not in the most user-friendly way.

    The impacts of a product could be useful, not only in one company, but several? I’d imagine quick database testing products to be useful at organizational levels.

    Figure 1 – feed configuration files in the request and receive a connectivity response. Login into the database later. Built on a containerized world.

    Footnotes

    1. This post was inspired by a real-world engineering scenario and the technical discussions that happened in a previous company.
  • TOTW/8 – Diagrams, Diagrams, Diagrams! The value of visual aids, and why software engineers need to visualize!

    Diagrams, Diagrams, Diagrams! Get me the diagrams!!! – A wise Principal Associate at a company I worked for in the past

    Let’s play out the scenario

    A junior engineer, Luis, is eager to present an incredibly technical topic on an up-and-coming multi-quarter project to her senior management and leadership. But before he can do so, his senior mentor figures, Estella and Anish, communicate to him in a design document review session to create diagrammatic figures.

    Luis feels perplexed. Why do my senior and staff engineers keep emphasizing good, thorough diagramming ( or other forms of visual aids ) to their junior engineers? Hey, isn’t my code ( or my code with verbal, written documentations ) satisfactory? The code and documents explain enough. Most of my team members ( seem to ) understand what’s going on and what our systems are doing, plus the architecture remains the same. This is just an extra 30-minutes to 1-hour of work that I don’t need to go doing.

    But au contraire, diagramming is useful work. It’s hard to understand the value of good diagrams, your scope is limited to feature development and coding on your team. You’re not the other parties. Such as your senior+ engineer who’s heavily involved in designing or upgrading existing systems as part of XFN ( Cross-Functional Work ) initiatives. Or your senior leadership and management who needs to make quick business decisions based on limited context. Or even product folks who need to quickly communicate their systems to non-product people and stakeholders.

    Yes it’s not coding work, but it’s crucial work – difficult to do well in its own rights, for some folks more than others. Alright, let’s dive deeper.

    What the others see that you don’t see – why visual aids?

    1. Your audience isn’t always technical : Visual aids help communicate to more than just an engineering audience. Audiences can span multiple types – brand new employees, product managers, management and leadership, or senior engineers on other teams. These audiences can not spend as much as time as you to throroughly understand your systems. Good engineers need to enable a fast understanding of operations, end outcomes, and the flow of data across systems.
    2. Design document credibility : diagrams strongly bolster the credibility of design documents.
    3. People love diagrams. Diagrams convey and communicate overly-complex technical concepts in a more ELI5 ( Explain-Like-I-am-Five) Form. State transition diagrams, for example, are hard to understand programatically or in writing, but are much easier to digest once diagrammed with vertices, edges, and sequence step numbers.
    4. Diagrams are frequently referenced : A Principal Analyst and a Senior Staff Engineer I once worked with were right!! Employees frequently reference diagrams. I’ve seen my state transition diagram referenced vertically during multiple pair programming sessions ( three three sessions were an hour-long ). I’ve also seen my architecture diagrams referenced in meetings involving multiple stakeholders. I think my diagrams were referenced in six plus meetings, each meeting 30 minutes long. There’s value add during those six hours of solid developer time.
    5. Real-time editing: I can quickly evolve and modify diagrams in real-time during engineering design discussions. I quickly jotted down textual notes and changed the directionality of arrows or the descriptions of components while absorbing inputs from more senior folks in my team or across teams.

    Can you show me a quick example of a digram people would reference?

    Sure. Here’s a quick cloud architecture diagram I took from online

    Figure 1 : Example cloud architecture diagram showing interactions within Enterprise private networks and externally. Diagrams facilitate discussions across many parties – the users ( who issue requests to API Gateway), the business analysts ( executing queries against analytics DB ), or Logging & Observability Teams ( who read data from S3 )

    What should I be diagramming?

    1. State Transition Diagrams
    2. Process Flow Diagrams
    3. Product developments and roadmaps –
    4. System Design/Architecture Diagrams

    But do I need to make overly complex diagrams?

    Not really. You don’t need to have the following
    1. A 100% fully correct diagrams
    2. An overly comprehensive diagram that drills down to the level of process execution or thread execution

    I’m not looking for overly complex diagrams.

    For example, in a state transition diagrams, I am focused on showing the flow of data from data sources source, through multiple input processing/sanitization/validation/filtering stages, the decision tree states where branches split up, and the end outcome states : the applications or the end users who consume the data.

    Links

    1. https://www.designdocs.dev/

  • SYSTEMS – Why do single locations of truth keep coming up in the industry. Onto the Recurring Pattern of Centralization!!!

    A Primer

    Freshly-minted, awe-inspired, recently matriculated from his undergraduate college, Alejandro, enters the workforce; he’s stunned at the level of complexity that he notices in the systems and infrastructure undergirding big tech. Inspired by a sense of interest, curiosity, and his volition, he spends some time diving deep into common system patterns and notices a recurring theme, which I’ll term as centralization. Whether it’s an OLAP database – purposed for analytical queries – acting as a sink to OLTP data sources, a central layer interfacing across multiple vendors that come in and come out, or a centralized logger to track requests across different machines and databases – centralization remains here to stay. The architectural pattern – fundamentally intrinsic to the DNA of big tech companies – will continue to persist.

    OLAP Database Sink for OLTP Database Sources

    Frequently across companies, you’ll encounter multiple enterprise web applications or internal-facing applications leveraging transactional databases. These databases span vendors – PostgresDB, MySQL, SqlServer, and Amazon DynamoDB, for example. In order to centralize the location of all this data into one common, easily-accessible location, data engineers and software developers will set up ETL pipelines to execute Extract, Transform, and Load Operations on the data chain. The flow of data follows from source OLTP Database -> Extract -> Transform -> Load -> sink OLAP Data warehouse. A major benefit with OLAP Datawarehouses is the dimensional storage capability – with data and relationships built atop Star and Snowflake schemas I won’t dive to much here. Additionally, OLAP Datawarehousing enables the OLAP cube capability – serving as a caching tier for frequently executed analytical queries. The OLAP Cube proves its usefulness for critical, high-revenue paying customers.

    Figure 1 ( sourced online ) – notice the ingestion across multiple OLTP Database vendors to a common OLAP Data Warehouse and the OLAP cube as a caching tier ,

    Centralized Logging – Tracking Requests and Responses across Machines and Databases

    #TODO

    Centralized Integration Layer – interface with multiple vendors and Enterprise systems; build long-term

    Alright third example of centralization. And probably by favorite. Also sometimes called an Integrational Layer. This architectural design pattern shares similarities with the OLTP-OLAP model, but there’s a minor difference with respect to the level of customization. OLTP to OLAP models tend to leverage already existing OLAP offerings ( e.g. Snowflake, Amazon Aurora, Google Big Query ). However, an Integration Layer is it’s own stand-alone “database esque” layer with custom application layer logic built atop. In this layer, data is either (A) collected and stored in an OLAP-esque style via Enterprise ETL pipelines or (B) queried via user-friedly interfaces or APIs. Whether or not an integration layer has its own data query language is up to the collaboration of engineering talent, internal stakeholders, and enterprise requirements.

    Figure 2 – taken from online, notice how an integration layer operates as an intermediary between the application layer ( above ) and the data layer ( below ).

    Benefits of Integration Layer

    1. Avoid vendor lock-in : using a single data source means being limited to the query capabilities offered by a single vendor. Built-in query capabilities may lack in complexity or ability to address ambiguous, unexpected business needs.
    2. Integrate as vendors evolve over time : centralization engenders the ability to add or remove data sources on a “plug-and-play” basis. If a technology needs to be sunsetted for Enterprise reasons ( e.g. the original provider no longer supports a soon-to-be-deprecated version or security mandates disallow usage of a given solution )
    3. Builds across business needs : Different business needs naturally entail unique data solutions. Some business needs lend themselves to SQL Server, some to to NoSQL Document stores, and others to Vector databases ( for modern day Generative AI ). A central layer storing all data means that multiple customers can access Enterprise data – spanning multiple locations – in one single authoritative location.

    Drawbacks of Integration Layer :


    1. Must build own query logic : The layers are custom-built, meaning that enterprise-side developers will need to either (a) build off atop existing query mechanisms or (b) create their own DQL ( Data Query Language ) to interact with the stored data.
    2. Involves build out time : A centralized layer can take a few quarters to build out, so as not to break existing applications relying on individual databases or subsets of databases.

    LINKS

    1. https://duniaxkomputer.blogspot.com/2016/04/what-is-meaning-of-oltp-etl-olap-and.html
    2. https://sourceforge.net/software/olap-databases/
    3. https://crealogix.com/en/blog/integration-layer-enables-future-data-driven-digital-banking
  • TOTW/9 – Avoid Log Bloat – Save your Company on Logging and Cloud Costs

    A Primer1

    Let’s imagine a scenario that could happen in the real-world.

    Ximena, a mid-level engineer, works at a banking company which leverages AWS as its cloud-hosting provider for infrastructure and scalability. She’s debugging the latest feature released to production; she’s spending a large chunk of her time performing root cause analysis and filtering out log files on AWS CloudWatch and Enterprise-logging software tools such as Splunk and New Relic. A couple of minutes into scrolling through the log files, a lightbulb flashes – she realizes something! “Wait second”, Ximena thinks to herself. “I can change the structure of our future logs and spend less time parsing and analyzing files. I bet this move could save time across the board and help my organization reduce it’s cloud spend.”

    Ximena, feeling excitement, quickly schedules out a 15-30 minute Outlook meeting. She briefly introduces her ideas to two other mid-level engineers, Chichi and Faisal. The three engineers collaborate; they engage in back-and-forth discussions, with Chichi and Juan offering advice and asking a few clarifying questions to Ximena. Both her other mid-level engineers love the idea – reducing log bloat. In the end, they all agree to it.

    Next week, changes to the codebase are noticed. Log files take up less space, and developers feel less pain triaging haystack-in-a-needle types of issues 🙂 !

    So how much are we saving? You got the numbers or the storage calculations?

    Alrighty then! Let’s imagine the differences of payloads we’re logging and make a few assumptions. Let’s assume we generate log files daily for a global event stream and that business requirements mandate the retention of logs in S3 for one year before transitioning them to compressed archival storage systems.

    1. 1,000,000,000 ( 1e9 ) events processed daily in an event stream
      ( think of a high-frequency trading firm processing 1B+ events for the NYSE or other major stock exchanges )
    2. A production-grade stream expected to service an application for one year.
    3. Request payload size = 1 kilobyte ( 1e3 bytes )
    4. Request metadata payload size = 100 bytes ( 1e2 bytes )
    5. Response payload size = 1 kilobyte ( 1e3 bytes )
    6. Response metadata payload size = 100 bytes ( 1e2 bytes )

    Wait but when does a request or response reach 1 kilobyte in size? Ok maybe that’s not the case for your personal apps, but enterprises frequently deal with large JSON or large XML payloads to retrieve analytical reports. They can get large.

    Storage calculations for logging with raw request and response payloads :
    1e9 events/day * 2 payloads/event * 1e3 bytes/payload * 365 days/year = 7.3 e14 bytes/year = 730 TB
    Storage calculations for logging with request and response metadata :
    1e9 events/day * 2 payloads/event * 1e2 bytes/payload * 365 days/year = 7.3 e13 bytes/year = 73 TB

    That’s a factor of a 10x reduction in log file output. Woah.

    Figure 1 – examples of storage pricing costs, per gigabyte, for Amazon S3 Standard ( taken 03/02/2025 ).

    For the sake of calculation, I’ll just use the first line item for pricing. We can view a cost delta of (0.023) * [(730 * 1000) – (73*100)] * (1 month / 1 year ) = $1,385 / month. WOAH! Multiply this over a year, and we get a delta of $16,622.1 per annum. There’s a huge savings potential there in the range of $10K+ in annual revenue netted by removal of log bloat.

    The benefits of log bloat reduction!

    1. Reduced cloud expenditures – exorbitant cloud costs pose bottlenecks for companies wanting to build out feasible solutions. Lowered cloud expenditures enable more customers to best utilize cloud offerings2
    2. Expedited developer velocity – developers can spend less time filtering, grepping, parsing, or searching through large collections of log files. It indirectly translates to faster coding, debugging, and product-ionization of applications.
    3. Output data flexibility – logging less data means fewer restrictions on what we need to output or take as input from log files. Request metadata schemas, for example, and more flexible than request body payloads.

    Conclusion

    I made a strong justification for why software developers should cut down on log bloat, as well as look into subtle optimizations that can be made on logging and infrastructure. The work is less appealing than coding up and productionizing a new feature under your ownership, but, the potential cost savings at scale and the reductions in wasted dev cycles can be mind-boggling! It’s worth taking a look!

    1. This scenario did happen – credits to my co-worker Jaime for noticing this optimization. ↩︎
    2. It’s complicated for the cloud companies here in terms of whether log bloat reductions help them net a profit. Cloud companies would loose on profits earned on specific services ( e.g. AWS Cloudwatch ) since less data would be dumped into Cloudwatch log files. But cloud providers could earn profits elsewhere; their customers could divest spending to other cloud capabilities of specialized offerings. I hypothesize that avoiding log bloat is a win-win for both cloud providers and customers. ↩︎

  • TOTW/10 – Bolstering your logging matters. Your more seasoned senior engineers are on the dollar.

    But logging work is so painful!

    Detoinne, an eager-to-learn, strongly self-driven junior engineer, wants to submit his code quickly to meet a feature deliverable. But his more astute senior engineer, Youngju, hightails on code review and she notices a lack of solid logging, monitoring, and observability statements. She also observes this on the functions’ code paths – both the paths ( 200 OK ) and unhappy paths ( 429 Error responses ) – before returning HTTP responses and errors to the end user.

    Detoinne feels frustration and bemoans in his head. “Ugh it’s so excruciating. My senior engineer is super pedantic about my code. Why do I even have to bolster the logging presence. This is so boring and painful.

    I hear you out. JIRA tickets titled “Refactor our centralized logging posture.” and back-and-forth code reviewers telling you to amend your logging statements can feel annoying. Your developer velocity, a key metric used in performance reviews, precipitously drops. But hear me out on the value of good logging – a couple of extra minutes spent during code writing and code reviewing can save your hours of debugging, triaging, and executing root cause analysis during the worst of production bugs and SEV-incidents, where you’ll need to scour hundreds of files to find a needle-in-a-haystack error.

    Not only in terms of saving time, but even with respect to upskilling as an engineer. Solid logging practices frame your thought process into thinking not just about a single run of execution on a local machine, but how your program interacts with multiple machines, failure modes, and assumptions. Better logging naturally engenders better readability and system design understandings.

    What would a junior engineer log?

    It’s not that junior engineers can’t write good logs, but they’re typically author log statements from the frame of reference of single executions on a local machine – typical of a classroom setting. They’re reminiscent of println(debug) or console.log(debug) statements – useful, but not well-suited for enterprise-grade production applications.

    println("Noticed bad request {request}").

    The debug statement – here, a println() statement’s – is not informative enough. An external developer will ask a couple of questions. Suppose for example, this request traces across multiple machines, triggering the calls of internal microservices or storage and retrieval of database-held enterprise records. An external developer naturally has a lot of questions.

    What clarifying questions would a senior engineer ask?

    1. Request protocol – Is it an HTTP, RPC, or another protocol that’s failing?
    2. Enterprise assets – What enterprise assets does the request correspond to? Is it a request for customer records retrieval?
    3. Request type – What request type is failing? Is it a failing /GET, /POST, or /DELETE?
    4. Error Code – Did I expect to see error codes? Should I be seeing a 4xx error code? Is the error code HTTP specific or Enterprise-specific enum?
    5. Request Metadata – Do I need to see request metadata too? How do I correlate the request ID to the request body being sent?
    6. Timestamp of failure – What time was the request sent? I lack timestamp information at a granularity of HH::MM::SS
    7. Location of failure – What machine, process, and thread did the request fail on? We don’t have notions of PID ( processID ) or TID ( threadID )
    8. Log severity – what’s the log severity? Should I halt program execution on a LOG:FATAL or dispatch a LOG:WARN to AWS CloudWatch logging and carry on with processing?

    What would a senior engineer log?

    Alright, we’ve gone over the clarifying questions. Let’s analyze how a senior developer would log a failed request, and what makes this better

    
    splunkLogger.log(LOG::FATAL, "Attempted to store customer financial record into database column {RESOURCE_URN} on database platform {DATABASE_PLATFORM}. Encountered malformed user request {REQUEST.METADATA} at timestamp {TIMESTAMP}. Failing on HTTP error code {HTTP_ERROR_CODE}.").
    
    1. splunkLogger.log – The usage of pre-existing logging framework libraries – such as those by third-party tools Splunk and New Relic – instructing (A) the logging software and (B) location of logs
    2. LOG::FATAL – incorporates enum/library-based warning message.
    3. store customer financial records – Explanation of Enterprise assets/business logic under execution in verbose message
    4. RESOURCE_URN – informs level of failure : database > schema > table > column
    5. DATABASE_PLATFORM – instructs DB type ( e.g. SQL, Amazon DDB )
    6. REQUEST.METADATA– dumps a lightweight representation of the failing request which can include other useful data such as customerId, customerName. We could scope down to just request.uid, but object hydration may be lacking.
    7. TIMESTAMP – informs the time of failure
    8. HTTP_ERROR_CODE – informs the error type ( e.g. HTTP 404 for Resource not Found cases )

    Do we have other benefits to logging?

    We absolutely do! It’s not just about saving developer cycles and resources whilst pre-empting future edge cases. There’s more!

    1. Enable fuzzy search or exact search – external developers can comb through log files and start typing in a few keywords to immediately locate an issue – especially across a collection of timestamp-ordered logfiles isolated to a single machine.
    2. Collection and aggregation of log metrics – do we need a count of how often we run into HTTP 404 errors? Do we need a count of how many LOG::FATAL versus LOG::ERROR messages we’re seeing and possibly reconsider changing log level granularity? Do we need to store these metrics into a database as part of upcoming business needs?
    3. Best practices standardization – if developers in a team or a company agree on unified logging practices and standards, shipping, reviewing, and debugging code speeds up.
    4. Formatting eases filling information – logging practices which follow well-defined formats enable engineering talent to quickly backfill in debug, warning, error, and fatal statements with the correct granularity of data.

    The Silver Lining

    I made a compelling justification for logging, introducing the many benefits across the domains of observability, monitoring, tracing, and debugging. To impart a silver lining, the earlier and the more frequent engineers practice good logging, the faster and more natural it becomes. It’s suddenly natural to think of good logging while writing source code before submitting to code reviewers. And like flossing, it’s better to learn this skill when starting out your tech career versus years down the road, where bad habits can develop.

  • TOTW/11 – When in doubt, write data-tier code versus application-tier code. You’ll thank yourself later !

    A brief primer

    Please save yourself from agony, developer cycles, data breaches, and future problems with a simple design change.

    Rock star junior engineer, Amro, needs to grab customer records held on data tier and process them for a OLTP transactional customer-facing web application. To meet a quick deadline, Amro immediately proceeds to grab raw data from the databases and introduce application-layer side stages – validation, filtering, and transformations. Amro starts writing additional lines of code and pushes out a quick PR ( pull request ) for his feature.

    But Amro’s senior engineer, Delia, foresees problems with this approach. She thinks pre-emptively of scenarios that Amro might not have thought about either due to a lack of domain expertise or experience working across tech companies. Delia thinks about problems that could arise with pushing out features immediately, as listed below :

    1. Less code is better code : Writing additional code always means the following – more locations for bugs, more breaking locations, and writing more unit tests or end-to-end tests. The more code at data tier, the less code at source tier : source code, unit tests, or end-to-end tests. That means fewer bugs.
    2. Minimize network traffic : Immediately grabbing raw data introduces large payloads under network transmission. This becomes especially problematic on scale-out scenarios reaching one million plus events. Can we minimize the volume of data being transferred? Let’s pre-empt and make huge cost savings and optimizations by passing 1 KB in place of 1 TB per day.
    3. Leverage database capabilities : SQL-esque databases have been around the block since the 1970s; NoSQL since the early 2000s. Thousands of database engineers, designers, and developers have hammered out and fine-tuned their offerings with highly-optimized capabilties spanning querying, filter, retrieval, fuzzy or exact search, and so on. SQL queries naturally get optimized by a SQL query planner running under-the-hood. Database compilers translate human-written queries to an optimized instruction set.
    4. Minimize cache or memory footprint : Retrieving raw payloads means having to store large chunks of information at application layer. This can lead to performance degradations or a lack of space at disk/cache/memory layers for more exigent, important processes. Let’s optimize memory ahead of time.
    5. Less dev work : We can remove stages for input validation, sanitization, transformations, of filters at application layer if we push more of that work at the data tier. We have fewer blocks of code or modules to write.
    Figure 1 : A 4 step flow of application-layer side processing of enterprise objects stored in data tier. Valid in some business scenarios, but not most

    Delia returns back to Amro with a better proposition and highlights better changes to the system architecture. She shows a visual aid to Amro with fewer sequence steps. The design evolution looks better.

    Figure #2 : data tier side execution of processing enterprise objects. Notice the reduced number of steps and the smaller payloads returned over network from database to application.

    But wait, there’s gotta be reasons for app-side processing!!! What are they?

    Ok ok, I hear you out. Application-layer processing still has merits, even if it entails extra network hops and extra LOC ( Lines of Code ) for source code and unit testing code. Let’s engage in multi-perspective thinking and cover cases when it’s needed.

    • Security constraints : Suppose you work for a financial company whose customer financial records are encrypted objects – decryption is restricted to application-layer code ( to pre-empt data breaches ). Enterprise justifications force application-side processing.
    • Your application needs a complete view of data : It’s rare, but it happens. Engineering requirements typically involve grabbing heavily-filtered subsets of rows or columns. But maybe requirements mandate grabbing all data for third-party auditing or comprehensive reports generation.
    • Datatier capabilities are lacking : I briefly touched on this earlier, but databases like SQL have existed since the 1970s – thousands of individuals poured their talents and efforts to making optimized databases for handling multiple tasks. But hey, maybe you can’t execute a very specific fuzzy text search, RegEx expression, or complex filtering on application side. Or data needs to be reformatted ( e.g. conversion of a list of tuples to a key-value dictionary ).
    • Application layer business logic complexity : This touches on point #3, but some companies execute complex enterprise logic on their business objects. And current research into data solutions – SQL or noSQL – don’t show good offerings. In that case, we’ll have to create objects ( in OOP ) or other abstractions at application layer to handle our requirements.

    Links

    1. https://excalidraw.com/#json=TEIM8-FnZ5RFeIcgECZ-P,zBHoGfCWw11AzZo3fBI7Xw
    Kudos to Excalidraw for enabling quickly making software engineering figures

  • SYSTEMS – Collecting and Monitoring Metrics in Large-Scale Systems – where do we even begin?

    But why can’t I just push out an application to production?

    No large-scale enterprise company – or for that matter, even a small start-up of 20 people or a mid-size organization – goes about building a system with zero data collections. Data collection is everywhere. It’s ineluctable and inescapable.

    Data needs to be collected to measure key measures – system performance, resource consumption, traffic spikes, packet delays, error rates. Without extensive collection and telemetry, the modern world would be a lot less modern. Now throw in the explosive growth of IoT ( Internet-of-Things), nearRT ( real-time ) streaming systems taking over batch systems, and an ever-expanding landscape of use cases for technical products – metrics and monitoring is growing.

    Figure 1 ( sourced online ) no matter where you go, you’ll run into an alerting and dashboards page showing visuals of real-time metrics like latency ( in average percentiles ) or the number of open connections

    How to think about what metrics to collect?

    Samantha is an entry-level junior engineer, and she looks at her senior engineers or senior staff engineers and goes thinking “how they heck do they know what to even collect”. It seems like rocket science to her. Wait, I was supposed to think about frequency of auto-scaling action triggers or the visibility timeout of message queues? I didn’t learn any this stuff back in my Undergraduate Algorithms or my Operating Systems class.

    The good news for Samantha is that good old common sense and a couple of thinking patterns can help identify where to begin. Let’s delve into some helpful strategies.

    1. Ask around : Identify organizational pain points and frequent systematic failures – if machines are frequently shutting down, it’s worth investing into crash-related errors, such as the frequency of LOG:FATAL messages in centralized logging.
    2. Think of analogs to existing systems : Suppose you have to collect metrics for Apache Kafka queues, but you don’t know much about Apache Kafka. But wait, you come in knowing AWS’s equivalent offerings such as Amazon SQS ( Simple Queue Service ) ( https://docs.aws.amazon.com/AWSSimpleQueueService/latest/SQSDeveloperGuide/welcome.html ) or Amazon KDS ( Kinesis Data Streams ) . You might know metrics such as message size, number of shards, and visibility timeout .
    3. A hypothesis always helps : The best thing to do in this profession is to make a hypothesis, where you want to prove an issue is X, based on Y. Then collect metrics for Y to assert that statement X holds true.
    4. Trial-and-error : When in doubt, try things and see what works. Your gut instinct and intuition can be surprisingly right – if you think it’s X, it’s probably X. As they say, where there’s smoke, there’s fire.
    5. Leverage your past experiences and domain expertise? : You may not have worked with average latencies ( P50-P95-P99 analysis ), but what about other systems in your technical domain? Maybe you had to analyze disk usage and how many page blocks you read or wrote back in your operating systems class. Or you built out a single HTTP request-response in a simple web app – hey, timing network calls is always a good start.

    But what if I collect the wrong thing?

    Actually this can be worthwhile too, because you’ll know what not to collect the next time you develop out your features. Fortuity has it that we’re in 2025 ( as of the time of this writing ) and not the 1950s – HDD ( hard-disk space ) and I think lower-end SSDs ( Solid-State Drives ) are surprisingly inexpensive. Five positive 8-byte only integer metrics collected at worst for breaking production for one day in a streaming system processing 1 million records daily would consume (1 million * 8 bytes * 5 metrics ) = 40 KB of hard-disk space. We can quickly clear that out.

    How to Collect, Process, and Store Metrics? The pros and cons of each approach.

    1. Local Log Files : Stored on the disk of each machine where an application executes
    2. Event Streams : To the event stream for nearRT streaming analytics. Consumers process the streams at the granularity of single events or as mini-batches
    3. Push :Leverage lightweight, easy-to-install push collection agents on each machine and forwarding to a separate cluster for longer-term persistence storage ( e.g. a time series database or centralized logging )
    4. Pull : Expose a /metrics endpoint ( or use common endpoints like /health ) to continuously poll these endpoints for critical information

    Useful Metrics To Collect

    By no means is this a comprehensive list, but it’s a note-worthy list to get yourself started!

    1. Scaling/cluster-level: frequency of auto-scaling actions, the number of instances ( currently running, stopped, crashed )
    2. Machine-level : CPU, Disk, and RAM utilization, collected at scoped-down aggregated granularities : per second, per minute, and per hour.
    3. Cache-level: number of cache hits, number of cache misses, and differences noticed in benchmark environments on changes to cache policies ( e.g. FIFO, LIFO, LRU )
    4. Queue-level – queue lengths, number of queues, frequency of queue thresholds being crossed ( e.g. 70% of a queue full need to reroute payloads to other queues )
    5. Networks: Number of open connections, open ports, average RTT ( round-trip time ), one way times ( client-to-server and server-to-client ), traffic volume flowing
    6. Centralized Logging Error Frequencies: Log errors ( FATAL, ERROR, WARN ), error codes ( HTTP 4xx or HTTP 5xx errors ).

    References

    1. Grafana image – https://grafana.com/static/assets/img/blog/kubernetes_nginx_dash.png
    2. System Design Interview – An insider’s guide – Vol 2, by Alex Xu’s . “Chapter 5 : Metrics and Monitoring”
  • SYSTEMS – Exponential Backoff over Once-Only Retry Mechanisms – persistence ( the right type, that is ) matters!

    The Pitfalls of Once-Only Retry

    We briefly touched upon the topic of accounting for failures in distributed systems : we can’t always assume that a client application will receive a response from a backend server. We must account for failure. In our world, Bob, a burgeoning junior engineer, thinks about working around a failing system with a quick fix. I’ll just send the request again – immediately after or with a time delay – and wait to receive a response back. Second time’s a charm, right?

    Well, in some cases. In the case of success, as shown below, Bob’s client application did receive the response back for the same request. But there’s remains the high failure probability, where Bob’s client fails to receive back a response.

    Once-only retry mechanism are quick work around fixes, but they fail to address the elephant in the room – the long-term issues that intrinsically arise from failure modes. Failure modes at the server machine level ( e.g. resource overload ), at network level ( a down ISP ), or a natural disaster ( a data center power outage ).

    Figure #1 : Once-only retry mechanism : the quickest short-term fix, but not a long-term fix for addressing failed processing of payloads.

    Migrating to Exponential backoff

    So what does the junior engineer Bob do? He heads over to his technical senior engineer mentor figure, Alice, and asks for technical recommendations and solutions. Alice’s first thought as the technical lead is to reference tried-and-testing industry ideas, such as exponential backoff. She recommends the idea of trying requests more than once, to account for the severity of downstream failure modes. Alright, let’s try out a request five times, with a client-side imposed delay of 100 milliseconds between each delay, and see if we receive a success.

    Attempt #1 : Fixed Window Time Intervals

    Figure #2 : Multiple request retries with a fixed time window strategy. It’s better than the first solution, but it’s still not the long-term fix!

    To their astonishment, it works. Hey it took five retries – with a max delay of 500 milliseconds from start to finish – but a request came back at the end! Hooray! Or not!

    Nope the real world is a complex beast, and we just ran into a fortuitous case where success happened within our expected time period. The strategy here is a good improvement on the prior strategy, but it’s to rigid.

    What if we run into cases where the requests usually come in earlier around the 400 millisecond mark? In this case, can we avoid sending the network requests? What if we can get away sending two?

    Or what if they come much later than 500 miliseconds, but still under 1,500 milliseconds? Do we have to send five requests, or can we send closer to four?

    A fixed window interval is a good idea, but it lacks in flexibility in terms of both configurability ( only one variable is easily adjustable ) and in real-world applicability. At the scale of a single invocation, changing from 3 requests to 2 requests doesn’t matter much. But at the scale of a billion transactions per day, such as in social media applications, where each request could entail a payload of size 1 KB, we’re talking about a network payloads savings reduction of 1e6*1KB = 1T/delay.

    That’s a major savings investment whose gains could translate to markedly reduced operational expenditures! And not only in terms of network, but even with respect to saved compute cycles for other concurrent operations, whilst still meeting end user Service-Level Agreements.

    Attempt #2 : Leverage Base and Power to Increase Success Probability

    Ok so we covered a fixed-window based exponential backoff strategy. But in the real world, a downstream service is unlikely to be up so quickly ( in the event of black-swan events of outages ). Client’s may also be able to afford additional wait periods for future request attempts, provided that a response can be returned within a final time window ( e.g. if I allocated 1 second of request-response time, I can theoretically wait for 900 milliseconds for successful processing.

    Let’s return to Alice the TL again. Alice collaborates with a staff engineer on her team, Sam. With Sam’s help, they agree on leveraging an exponential backoff strategy, where in place of a single constant for a fixed time-window, they use the combination of two variables – a base and a power – to increase each successive retry execution. For example, with a constant of 100 milliseconds, a base of two, and a power cap of four, they build for retries following a mathematical sequence : 100*(2)^0, 100*(2)^1, 100*(2)^2, 100*(2)^3 – corresponding to 100, 200, 400, 800. Now the client’s will know at run-time how much wait time to endow for each successive request if it fails to receive a response back from a server.

    And the strategy works better. Alice, Sam, and Bob observe that exponential backoff outperforms both once-only retry and fixed time-window strategies. They take notice that in the cases that responses come back earlier ( e.g. 400 milliseconds ), they send fewer requests, and in the case they return back later ( e.g. 1500 milliseconds ), they can still expect a response back in the event of success.

    Figure #3 : True Exponential backoff with monotonically-increasing time intervals. We can configure initial time interval based on benchmark experiments and update them accordingly via analytics conducted in production environments.

    What to clarify and ask when migrating over to new strategies?

    1. Do we still meet expected SLAs or SLIs for our end customers if we choose to leverag a new retry strategy. For example, if we have to meet a latency SLA of <= 200 ms time, we can’t configure for 100ms of wait between 5 retries of exponential backoff? We either (A) need to configure shorter time periods or (B) need to configure for fewer.
    2. How do we determine the optimal base and power? There’s tradeoffs to selections.
    3. To big of a base or power – increasing latency and application performance degradations
    4. To small of a base or a power – increasing failure likelihood; inability to account for cases when a downstream service could have had a working response ready if we provided a bigger buffer window; failure to retrieve responses for critical upstream clients.
    5. How do we account for failed requests, even with exponential backoffs? Do we immediately error out to upstream clients? Or do we leverage techniques such as DLQs ( Dead-Letter Queues ), where we store the requests for future analysis? Do we retry failed requests on a later time or date ( perhaps one or two days from now ) when systems will be up and running ?
    6. How do we balance the priority of old, failed requests in an exponential backoff loop with continuous new, incoming requests? We can’t always let old requests take the highest precedence without new requests accidentally ending up in the exponential backoff scenario? Can we set up for optimal prioritizations in our request queues? This entails a transformation from a regular FIFO – First-In, First-Out – Queue to a priority queue, but can lead to performance gains and meeting end user requirements.

    In Conclusion

    Overall, I made good argument with accompanying visual diagrams for why to consider exponential backoff over once-only retries or fixed time window interval retry strategies. A battled-hardened, tried-and-tested industry strategy, exponential backoff serves as a solid foundation for making quick improvements to major infrastructure problems. It’s use cases – social media applications, data engineering pipelines, or payments processing flows – further supports its consideration.

    References :

    Exalidraw Link : https://excalidraw.com/#room=c24d2cf7aa80b854542a,dl2NkWc-cilvzptmi1dLQw

  • SYSTEMS – The many failures and faults in our distributed systems

    A primer

    Debugging and triaging issues in distributed systems is non-trivial – in fact, I’d argue that thinking and building for distributed systems makes most professional software engineer jobs difficult; more than coding. Coding up an application is easy, but not when you run into the scenarios of scalability, rate limiting, large data volumes, or high-IOPS nearRT streams of 1+ million records/seconds.

    It’s already difficult getting a single machine to agree to operate the way you want; now, you’re thrusted into a universe involving multiple machines and networks, each of which introduces unexpected failure domains. Let’s dive into some basic issues plaguing such systems.

    Message Transmission Failures

    Conducting a root cause analysis on message transmission failures between a single client and a single server is difficult? What’s the cause of transmission failure? Was it even transmission failure? A processing failure? Can we even triage the sources of failures? Let’s look at four failure modes with the simplest distributed system known to people-kind ( yes, women-kind and man-kind ) : two standalone machines/nodes communicating with each other in an HTTP-esque request-response style pattern.

    1. Client-side process started but fails to process payload.
    2. Client-side application sends payload over on request, but message drops before reaching server.
    3. Server-side process received the message, but failed to process succesfully.
    4. Server-side process sends payload over on response, but message drops before reaching client.
      ( https://excalidraw.com/#room=60dbd3c682e2803e291f,KU69vHg4E_ifgZp7NvNzSA )
    The simplest distributed system – a client and a server sending and receiving payloads. Think of a basic SYN-ACK from an undergraduate intro to computer networks class.

    Given this set up, what do we do next?

    In the ideal world, where we could run off the assumption that both machines could persist a healthy, long-term network relationship, we can minimize the level of logging, tracing, and debugging. Systems would run smoothly if network communication worked 100% of the time. But that’s not the case. Networks will fail. They fail all the time. And we need to be systems that account for failing networks.

    More ever, we typically have access to only one of these machines in most real-world business scenarios. Sometimes, this is due to legal, compliance, and organizational reasons ( e.g. different Enterprise organizations or teams own their own microservices ). Or due to service boundaries when communicating across B2B ( business-to-business ) or B2C ( business-to-customer ) applications. In such a case, we access only a client side application sending outbound requests to third-party APIs or a server-side application processing inbound requests via /REST-style API endpoints ). Logging and telemetry reach their limits too; in a world with four moving components of potential failure, we access only one.

    Network Failures

    Computer networks can fail for a multitude of reasons. Let’s list them out

    1. Data center outages
    2. Planned maintenance work ( e.g. an AWS service under upgrade )
    3. Unplanned maintenance work
    4. Machine failure ( from age or overload )
    5. Network overload ( e.g. (Distributed) Denial of Service attacks, metastable failure, faulty rate limiting )
    6. Natural disasters – floods, hurricanes, heat waves disrupting components
    7. Random, non-deterministic sources ( e.g. within Cat-5E ethernet cables, a single packet of light fails to transmit from source to destination ).

    Process Crash Failures

    1. Insufficient machine resources – CPU, Disk, RAM
    2. Unexpected data volume
    3. Thundering herd scenario ( DDOS, Prime Day sales, or popular celebrity search spikes ).
    4. Black swan events / non-deterministic causes – machines aging or single bits at CPU register levels having a one-off error
    5. Run-time program failures ( e.g. call stack depth exceeded, infinite loops, failures to process object types from callee to caller )
    6. Atypical or incorrect input formats
    7. Hanging processing on communication to other components ( e.g. async database read or writes ).